The Power and Practicality of Colorful Data Visualization
In a world saturated with information, presenting data clearly and persuasively is a fundamental skill across business, academia, and marketing. The concept of colorful statistics or colorful analysis moves beyond simple charts and graphs to embrace a deliberate, strategic use of color to enhance comprehension, highlight narratives, and guide viewer attention. This approach is not merely about making presentations aesthetically pleasing; it is a functional methodology that leverages the psychology of color to improve data communication.
What Makes Colorful Data Visualization Distinct?
Traditional data visualization often prioritizes accuracy and structure, sometimes at the expense of engagement. Bar charts, line graphs, and pie charts in monochrome or limited palettes convey the facts but may fail to make them memorable or intuitively understandable. Colorful statistics introduces a layer of cognitive design. It uses color to categorize, signify importance, indicate trends, or create visual hierarchies within the data itself.
The core distinction lies in treating color as a key data dimension, not just a decorative element. For instance, in a corporate report showing regional performance, a standard map might use shades of one color. A colorful analysis approach might employ a carefully chosen, multi-hue palette where each color represents a different product line, allowing the viewer to instantly cross-reference geography and product success in a single, cohesive infographic.
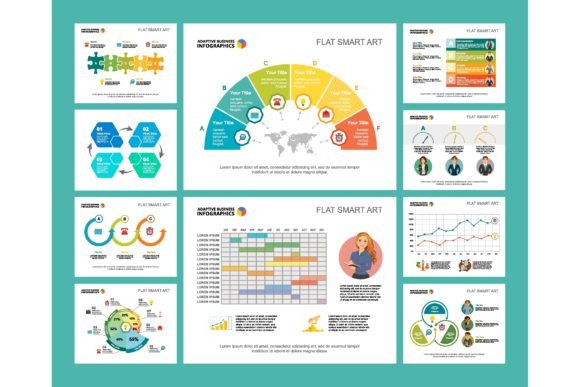
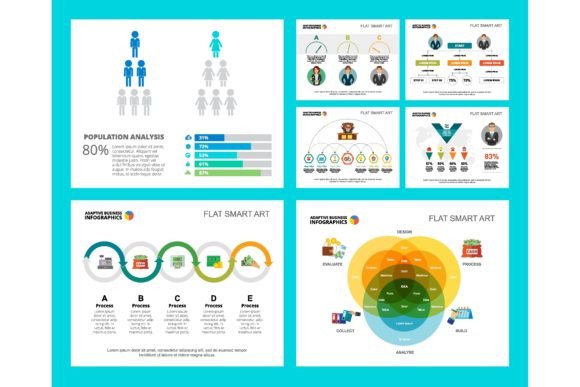
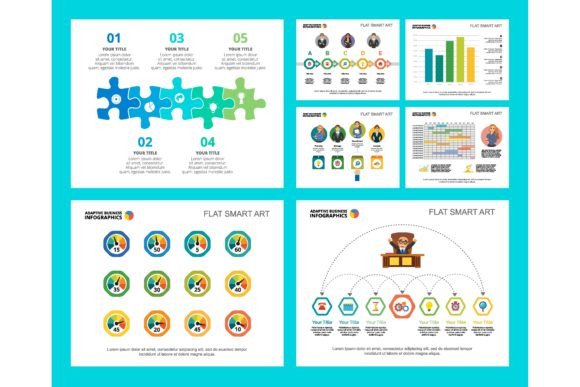
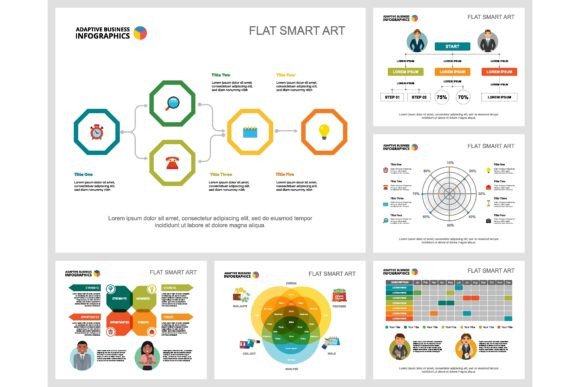
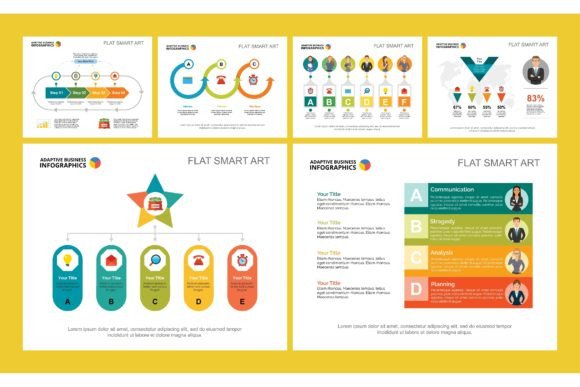
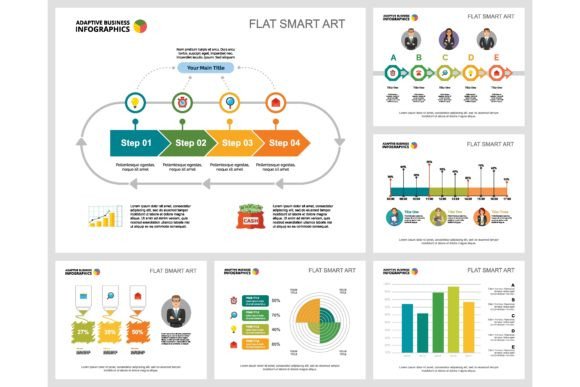
This methodology is particularly embodied in modern infographic chart sets and business design elements designed for presentation slides, reports, and advertising layouts. These templates are built with color schemes that are both visually harmonious and functionally segmented, enabling presenters to plug in their data while maintaining a consistent visual logic.
Comparing Approaches: From Minimalist to Colorful
When evaluating how to present your analysis, it’s useful to consider the spectrum of available styles. On one end lies the minimalist, often single-color approach. Its strengths are clarity and a formal, serious tone. It avoids potential distractions and is universally accessible, including for those with certain color vision deficiencies. The tradeoff is that complex datasets can become visually dense and difficult to parse quickly.
On the other end is the colorful statistics concept. Its primary advantage is enhanced differentiation and recall. Our brains process color faster than shape or text, so using it to group related data points can speed up understanding. A well-designed colorful infographic can tell a story at a glance, making it ideal for leaflets, posters, or advertising where immediate impact is crucial. The limitation, however, is the need for careful design. Poor color choices—such as using non-complementary hues, overly vibrant palettes, or colors with cultural connotations that clash with the data—can lead to confusion or misinterpretation.
A third, hybrid approach uses accent color. This balances the two, employing a neutral base with strategic color highlights only for key findings or outliers. This is often a safe, effective choice for internal corporate reports where the data is the primary focus, but certain conclusions need to be emphasized.
Key Decision Factors in Choosing Your Style
Your choice between a colorful, minimalist, or accent-based approach should hinge on several practical factors:
- Audience and Context: A technical, detail-oriented audience reviewing a financial audit may prefer minimalist precision. A marketing team pitching a new campaign to clients will benefit from the engaging, narrative-driven potential of colorful analysis.
- Data Complexity: Simple datasets with few variables rarely need a full colorful palette. Conversely, multifaceted analysis involving multiple categories, time periods, or geographic regions can become clearer with color coding.
- Medium and Format: Presentation slide templates benefit from color to maintain visual interest across many slides. For a printed leaflet layout where space is limited, color can compress information by replacing textual labels. A large-format poster design almost necessitates strong color use for visibility and impact.
- Brand Alignment: The colors should align with or complement existing brand guidelines. Colorful statistics should be integrated professionally, not clash with corporate identity.
Strengths and Optimal Use Cases for Colorful Analysis
When applied correctly, the colorful statistics concept offers tangible benefits. It improves the speed of data absorption for the audience. It can highlight correlations and patterns that might be missed in a table of numbers. Furthermore, it increases the memorability of the information presented, a vital consideration in advertising and investor presentations.
This approach is often the right choice in specific scenarios:
- Comparative Analysis: When directly comparing multiple entities, products, or timeframes, color provides an instant visual cue for comparison. For example, a chart comparing four alternative software platforms could assign a distinct color to each, making follow-up discussions about their individual metrics much easier.
- Trend Visualization: Showing progress over time, such as quarterly sales growth, can be enhanced with a gradient color scale where intensity or hue change reflects magnitude.
- Public-Facing Materials: In leaflets, posters, and advertising layouts, where the goal is to attract attention and convey key messages quickly, colorful infographic charts are highly effective.
- Executive Summaries: High-level reports for busy decision-makers can use color to draw eyes directly to critical KPIs, risks, or opportunities, acting as a visual executive summary.
Understanding the Tradeoffs and Limitations
Adopting a colorful analysis concept is not without its demands and potential pitfalls. The most significant tradeoff is the increased need for design skill or quality template resources. Not everyone is a natural designer; haphazard color selection can render the data less clear than a simple black-and-white chart. This necessitates either investing in professionally designed business design elements and presentation slide templates or acquiring basic knowledge of color theory and accessibility.
Accessibility is a crucial limitation. Some color combinations are difficult for individuals with color blindness to differentiate. Tools and templates built for colorful statistics should consider using patterns or textures as secondary cues, and always testing palettes for accessibility. Furthermore, color can sometimes introduce cultural bias; a color representing “profit” in one culture might not carry the same subconscious association in another.
There are also situations where colorful statistics may be the wrong choice. Highly sensitive or somber data, such as certain healthcare statistics or loss reports, may require a more restrained visual approach. When the raw data itself is so complex that visual simplification might misrepresent its nuance, a detailed, text-based table might be more appropriate, even if it’s less visually engaging.
When to Consider Another Option
You might need to explore alternatives to a full colorful statistics approach if your primary goal is absolute, unambiguous precision for a specialized audience, such as in scientific research papers or legal documents. Here, color should be used sparingly and only with clear, defined legends.
Similarly, if your resources are limited—with no access to design software or quality templates—and you must produce a report quickly, a clean, minimalist chart generated from standard office software may be more practical and still perfectly effective. The key is to match the tool to the task and the audience's needs.
Making an Informed Choice for Your Project
Ultimately, the decision to utilize colorful statistics or a more restrained style comes down to a balance between function, audience, and resource. Begin by defining the core objective of your communication: Is it to inform, persuade, alert, or compare? Then, assess who will receive it and in what format.
For many common business needs—creating a corporate annual report, designing a product launch presentation, or crafting an informative advertising leaflet—the principles of colorful analysis offer a powerful middle ground. They marry the rigor of data with the psychology of visual communication. By leveraging thoughtfully designed infographic chart sets and templates, you can achieve professionalism without requiring deep design expertise.
The most effective data communicators are not those who always use the most color, but those who understand when color serves the data and when it might detract from it. By evaluating your specific scenario against the strengths and tradeoffs of the colorful statistics concept, you can select the approach that makes your analysis not only seen, but truly understood.