The Power of Visual Data and Team Collaboration in Modern Business Communication
In the fast-paced world of corporate decision-making, clarity and persuasion are paramount. Two concepts that sit at the heart of effective communication are colorful statistics and the fundamental teamwork concept. These are not just abstract ideas; they are the practical building blocks of compelling presentations, insightful reports, and impactful marketing materials.
Beyond Numbers: Making Statistics Speak with Color
A spreadsheet filled with raw data is often a story waiting to be told, but it can be a difficult one to read. The strategic use of color transforms these numbers from passive figures into active communicators. When we discuss colorful statistics, we're talking about the deliberate application of hue, saturation, and contrast to data visualization elements like charts, graphs, and infographics.
The purpose is twofold: to enhance understanding and to guide emotional response. A warm color like red can instantly draw attention to a critical KPI that is under target, while a consistent green across a bar chart can communicate growth and success. This visual coding allows audiences, from board members to potential clients, to grasp complex trends and comparisons at a glance, reducing cognitive load and speeding up consensus.
Consider a corporate annual report. A section on market share could present a simple pie chart. But a pie chart using distinct, carefully chosen colors for each competitor not only differentiates them clearly but can also subliminally associate your company's slice with a positive, trustworthy color like blue. This subtle layer of persuasion is a core benefit of integrating the colorful statistics approach into your design workflow.
Designing Effective Infographic Charts for Team Alignment
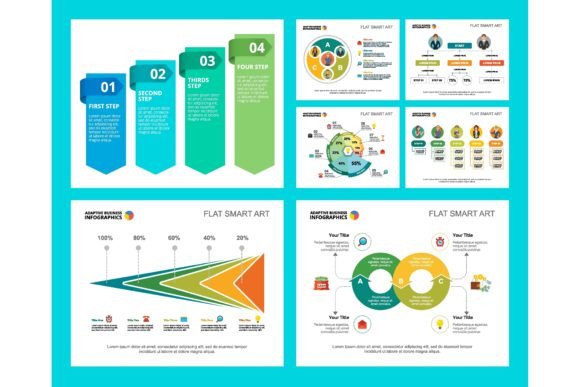
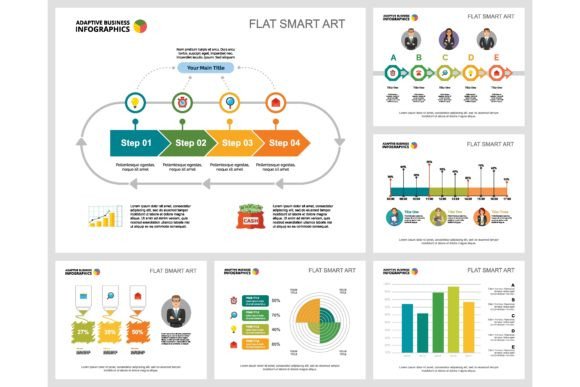
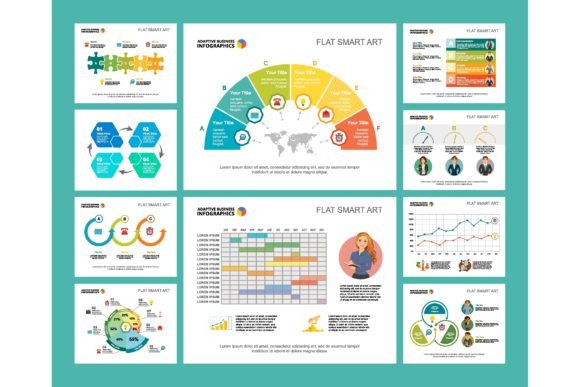
Where this truly comes alive is in the context of the teamwork concept. Modern projects are collaborative, often involving cross-functional teams with diverse expertise. An engineer, a marketer, and a financial analyst need to share a common understanding of project status. A well-designed infographic chart set acts as a universal language.
These sets—perhaps a combination of a timeline, a progress tracker, and a resource allocation heat map—provide a shared visual dashboard for the team. Color is used here to denote roles (each team member's contributions in a unique color), priorities (high-priority tasks in bold yellow), or statuses (completed, ongoing, delayed). This visual common ground prevents misinterpretation of data and keeps every team member, regardless of their primary function, aligned on the same objectives and realities. It turns abstract collaboration into a concrete, visible process.
The Teamwork Concept as a Design Principle
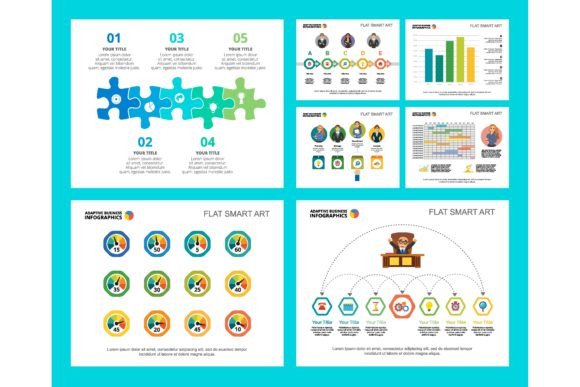
Interestingly, the teamwork concept itself can be visualized and reinforced through design. In presentation slide templates aimed at team building or project kick-offs, designers often use metaphorical visuals: interconnected gears, a mosaic of diverse shapes forming a whole, or a flowchart showing input from various nodes.
These elements do more than decorate a slide; they frame the discussion. They visually reinforce the message that the project is a collective effort. When used in advertising or a leaflet for a company promoting its collaborative culture, these visuals immediately signal a core value to potential hires or partners. The design becomes a direct reflection of the operational philosophy, making the teamwork concept tangible before a single word is read.
Integrating Visuals into Your Business Materials
So, how do you adopt these principles for your corporate report, advertising campaign, or poster design? It starts with intent. Before choosing a template or creating a layout, ask: What is the primary story I need this data to tell? and How does collaboration or collective effort feature in this narrative?
For a leaflet layout advertising a new service, you might use an infographic to quickly show how your team's multi-step process benefits the client. A flowchart with color-coded phases (client consultation in blue, solution design in green, implementation in orange) visually communicates a seamless, integrated teamwork concept.
In a poster design for an internal corporate event, vibrant charts showing department achievements, all using a unified color palette, can celebrate individual contributions while visually stitching them into the larger tapestry of company success. This not only recognizes effort but also promotes a continued culture of collaboration.
Practical Benefits and Key Considerations
The practical benefits are significant. Materials built around colorful statistics and the teamwork concept lead to faster comprehension, stronger retention of information, and more persuasive outcomes. They can reduce meeting times spent explaining data and increase the impact of public-facing advertising.
However, there are important factors to consider. The use of color must be logical and consistent. A random, overly vibrant palette can confuse rather than clarify. Always consider color accessibility—ensuring contrast is sufficient for readability and that information isn't conveyed only by color for those with visual impairments. Similarly, a teamwork-focused visual should be authentic; it should reflect a real collaborative process, not just an idealized graphic.
When selecting or creating presentation slide templates and business design elements, look for those that offer flexibility. A good template provides a coherent system for color-coding data and includes visual motifs (like linking lines, combined icons) that can represent collaboration without needing custom illustration from scratch. This allows you to efficiently produce professional materials that embody these powerful concepts.
Driving Projects and Industries Forward
Across industries—from tech startups to established manufacturing—the integration of clear visual data and collaboration visuals into communication workflows is becoming standard. In project management, agile teams rely on shared digital dashboards using color-coded Kanban boards. In sales and marketing, pitch decks use competitor comparison charts where color strategically positions your offering.
These are not mere decorations. They are functional tools that drive understanding, alignment, and decision-making. By harnessing the communicative power of colorful statistics and visually embedding the teamwork concept into your reports, ads, and presentations, you transform information into insight and collective effort into a compelling visual story. This approach ensures your message is not only seen but also understood, remembered, and acted upon.