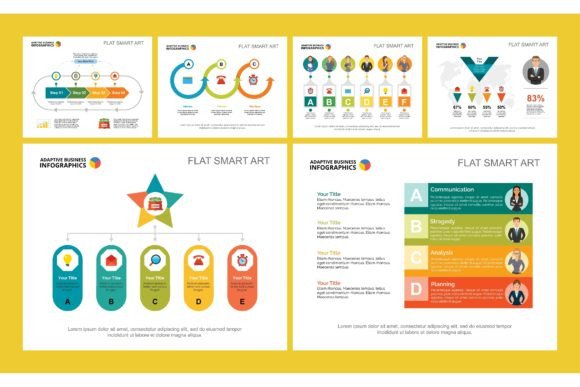
The Art and Strategy of Colorful Research Concept in Professional Presentations
Imagine walking into a conference room, or opening a corporate report, and being greeted by a wall of grey text and monochrome bar charts. The information might be sound, but the engagement is zero. This is where the Colorful Research Concept becomes a critical tool, not just a decorative choice. It's the strategic application of color, iconography, and visual hierarchy to transform complex data and ideas into compelling, understandable narratives. People are drawn to it because, in a world saturated with information, clarity and memorability win.
Misunderstanding Color as Mere Decoration
The most common mistake is treating color and design elements as a final polish, a "make it pretty" step. This approach overlooks color's functional role in communication. A splash of random color doesn't aid understanding; it can create confusion. For instance, using red arbitrarily in a financial report might inadvertently signal danger or loss, even when the data is positive. The Colorful Research Concept is not about aesthetics divorced from content; it's about using visual language to reinforce your message.
This misstep directly affects presentation impact and audience comprehension. Poor color choice can make charts harder to read, obscure key data points, and even cause viewers to misinterpret trends. Your research's credibility can be subtly undermined if the visual presentation feels chaotic or unprofessional.
A Better, Strategic Approach to Color
Start with your research narrative. What is the single most important finding? That key insight should be visually anchored with a distinct, prominent color. Use a consistent palette across all infographic charts—perhaps three primary colors for main categories and muted tones for supporting data. Ensure your colors have sufficient contrast for readability in both digital slides and printed leaflets. Think of your color palette as a code that guides the viewer through your logic.
Overlooking the Infographic Charts Set as a Unified System
Another frequent error is treating each chart or design element as an isolated unit. You might download a beautiful pie chart template and a sleek bar chart template from different sets, only to find their styles clash—different fonts, incompatible color palettes, mismatched icon styles. When slapped together on a single slide or report page, the result feels fragmented and amateurish.
This lack of cohesion hurts efficiency and brand perception. It forces last-minute adjustments, eats up time, and communicates a lack of attention to detail. For corporate reports and advertising materials, consistency is synonymous with professionalism.
Before downloading or buying any template set, check for systematic design. A quality Colorful Research Concept infographic charts set should offer:
- A unified color palette with defined primary and secondary colors.
- A consistent family of icons and graphical elements.
- Compatible chart types (bar, line, pie, process) that share the same stylistic DNA.
- Typography guidelines that specify fonts for headlines, body text, and data labels.
Prioritizing Complexity Over Clarity in Business Design Elements
In an attempt to showcase sophistication, many fall into the trap of over-designing. They use every available element: shadows, gradients, complex 3D effects, and a dozen icons on a single slide. The Colorful Research Concept should simplify, not complicate. The goal is to make the research accessible, not to create a visual puzzle.
Overloaded slides reduce usability. They distract from the core message, making it difficult for the audience—whether executives, clients, or consumers—to grasp the point quickly. In leaflet and poster design, where glance-value is paramount, clutter is a fatal flaw.
Embracing Minimalist Impact
Use business design elements with purpose. A single, strong icon can represent a whole concept more powerfully than five small ones. Allow ample white space (or "quiet space") around charts and text to let the information breathe. Ask yourself for each element: "Does this help my audience understand?" If not, remove it. A clean, focused slide template with a bold color accent on the key metric will always outperform a busy, colorful carnival of data.
Negating Accessibility and Audience Context
A crucial, often overlooked detail is designing for your actual audience and medium. A vibrant digital slide might look perfect on your monitor but become illegible when printed in black and white for a handout. Similarly, colors that work for a tech-savvy marketing team might not resonate with a more traditional financial audience.
Ignoring context affects satisfaction and communication efficacy. Your beautifully colored research fails its mission if the recipient can't properly see or interpret it.
Always check the final output medium. For printed reports and posters, verify color contrast works in greyscale. Consider cultural connotations of colors in international advertising. Ensure color-blind friendly palettes are available—using both color and pattern differentiation in charts. This thoughtful application makes the Colorful Research Concept truly inclusive and effective.
The Template Trap: Assuming Download Equals Expertise
Many beginners and professionals alike believe that buying a premium template set completes the design work. This is a misunderstanding. Templates are a superb starting point and a guardrail against poor design choices, but they are not a substitute for strategic thinking.
Applying a template without adapting it to your specific research content leads to generic, "cookie-cutter" presentations. Your unique insights get lost in a pre-formatted box. The cost here is the lost opportunity to stand out and to have your work remembered.
The better approach is to use templates as a foundation. Customize the provided infographic charts to highlight what's unique in your data. Adjust the color palette if your brand or message requires it. Replace generic icons with more specific ones if needed. The template provides the system; you provide the intelligence. This collaborative process between the tool and the user is where the true Colorful Research Concept shines, merging professional design with personalized research storytelling.
Ultimately, adopting the Colorful Research Concept is about recognizing that how you present your research is inseparable from the research itself. It demands a shift from seeing color and design as optional to viewing them as integral components of clear, persuasive communication. By avoiding the common pitfalls of decorative thinking, systemic neglect, over-complexity, and context blindness, you can leverage these powerful visual tools to ensure your hard work gets the attention, understanding, and impact it deserves.