Beyond Monochrome Strategy: The Rise of Colorful Planning in Business
In a world saturated with data and complex processes, clarity is currency. Traditional management frameworks, often visualized in stark blacks, whites, and grays, can struggle to capture the dynamic, interconnected nature of contemporary projects and goals. Enter the concept of Colorful Planning or Management. This is not merely an aesthetic choice for slides or infographics; it is a deliberate methodological approach that uses color as a functional tool to encode information, delineate responsibilities, track progress, and inspire engagement. It represents a shift from flat, linear planning to a multidimensional, visually intuitive system.
What is Colorful Planning?
At its core, Colorful Planning is the systematic application of color coding to enhance comprehension, communication, and execution within business and project management. It transforms abstract data and complex workflows into visually accessible maps. Each color is assigned a specific semantic meaning—for example, red might denote high-priority tasks, blue could represent research phases, green indicates completed milestones, and yellow highlights collaborative touchpoints. This coding creates an immediate, universal language within a team or report, reducing cognitive load and accelerating decision-making.
This concept extends beyond simple task lists. It encompasses financial reports where revenue streams, cost centers, and growth metrics are color-differentiated for instant analysis; workflow layouts that visually pipeline stages from ideation (purple) to delivery (orange); and brochure designs that use color zones to guide a reader’s journey through information. The underlying principle is that color, when applied with strategic intent, is a powerful information-processing shortcut.
The Context: Why Colorful Management Resonates Now
The relevance of Colorful Planning is amplified by several converging trends across industries and professional lifestyles.
The Visual and Cognitive Demand
Professionals today are expected to synthesize information rapidly. The proliferation of data visualization tools and dashboard-centric platforms underscores a market shift towards visual literacy. Colorful management aligns perfectly with this expectation, turning dense textual plans into intuitive charts. For entrepreneurs and freelancers juggling multiple client projects, a color-coded system provides an at-a-glance status update, reducing administrative friction and mental clutter.
Collaboration in Distributed Workflows
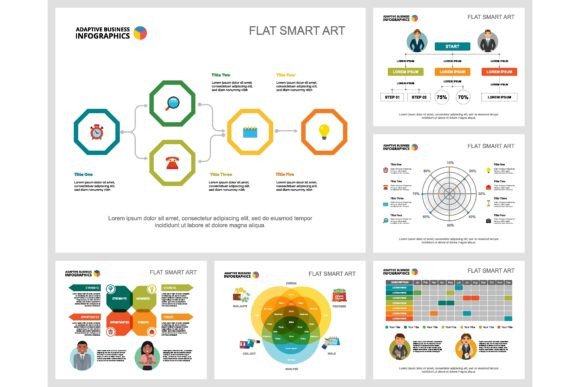
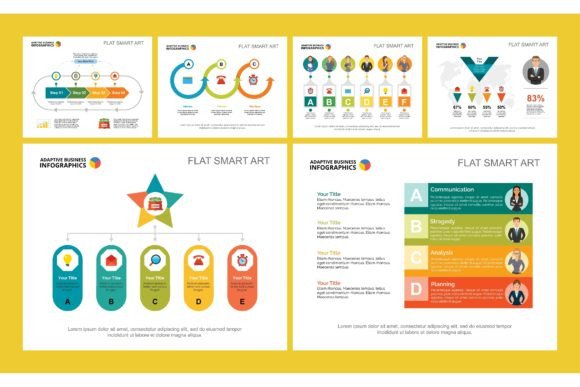
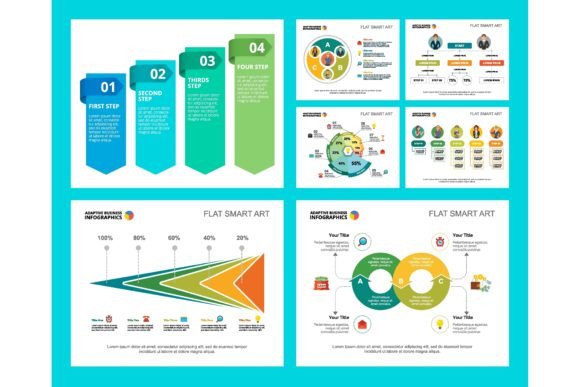
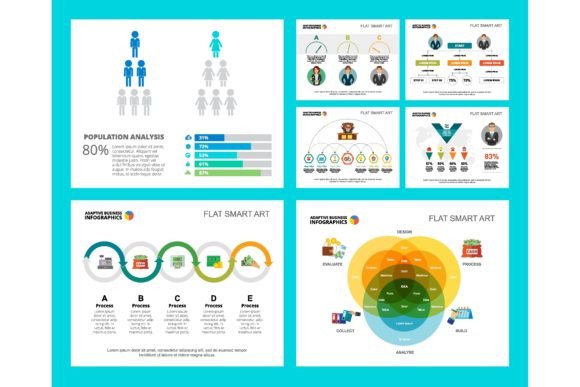
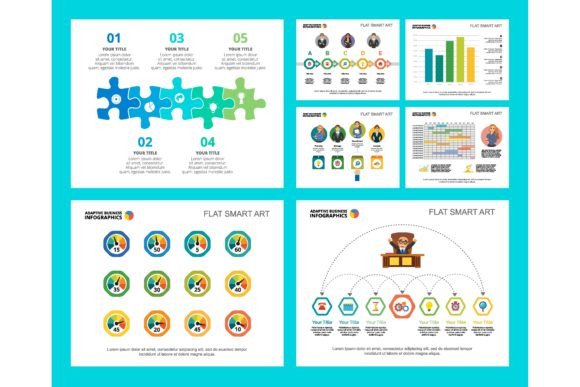
With hybrid and remote work becoming entrenched, clear asynchronous communication is paramount. A Colorful planning infographic chart set embedded in a presentation slide template acts as a central, unambiguous reference point. Team members across different time zones can instantly understand a project’s landscape: who is working on what (by department color), what stage a task is in (by phase color), and where attention is needed (by priority color). This eliminates lengthy email clarifications and creates a shared visual workspace.
From Reporting to Storytelling
Modern financial reports and business presentations are judged not only on accuracy but on persuasiveness and engagement. Stakeholders, from investors to internal teams, seek narratives, not just numbers. Strategic use of color can guide the viewer through a story—using warm colors to highlight growth opportunities and cool colors to contextualize challenges—making the data more memorable and impactful. This bridges the gap between analytical rigor and creative communication.
Practical Applications and Observations
The implementation of Colorful Planning or Management Concept is versatile, adapting to various business design elements.
In Project Management and Agile Frameworks
Consider a product development sprint. Instead of a standard spreadsheet, the roadmap uses a color-coded Kanban board:
- Red Cards: Critical bugs or blockers.
- Blue Cards: Backend development tasks.
- Green Cards: Completed and approved features.
- Yellow Cards: User interface or design elements.
For Financial Analysis and Investor Relations
A quarterly financial report designed with colorful management principles might segment performance visually:
- Use a consistent teal color for all recurring revenue streams across charts.
- Apply a distinct amber color for one-time project-based income.
- Highlight operational costs in a neutral gray, allowing the revenue colors to stand out for quick ratio assessment.
Enhancing Creative and Marketing Campaigns
Marketing teams planning a multi-channel campaign can use a color-coordinated timeline. Social media phases (Twitter blue, Instagram magenta), content creation (blog green), and advertising spend (display gold) are plotted on a unified calendar. This holistic view prevents channel silos and ensures integrated messaging. The colorful management concept here acts as a synchronization tool, aligning creative output with strategic deployment.
Connecting to Larger Developments
The embrace of Colorful Planning is part of a broader movement towards human-centric design in business tools. Technology is increasingly focusing on user experience and reducing friction. Management software, from Notion to Monday.com, now offers extensive customization and color-coding features, responding directly to this demand. Furthermore, it intersects with the growing importance of neurodiversity in the workplace; visual planning systems can be more accessible to individuals with different cognitive processing styles than purely textual or numerical formats.
It also reflects a maturation in business aesthetics. As noted, professionals, creators, and enthusiasts now expect tools that are not only functional but also professionally polished and engaging. A well-designed Colorful planning infographic charts set for presentation slide templates conveys competence, attention to detail, and modern thinking, enhancing brand perception internally and externally.
Implementing with Strategic Intent
Adopting this concept requires thoughtful application. The key is consistency and contextual relevance. A color schema should be documented and shared, becoming part of the team’s or organization’s lexicon. It should also be tailored to the specific audience—a technical workflow might use more subdued, functional colors, while a consumer-facing brochure might employ a vibrant, emotionally evocative palette. The goal is always to serve clarity and purpose, not merely decoration.
As workflows evolve and information density increases, methodologies that enhance cognitive efficiency become strategic advantages. Colorful Planning or Management Concept offers a simple yet profoundly effective way to map complexity, foster alignment, and communicate with impact. It turns management artifacts—from the financial report to the project workflow—into intuitive, actionable, and collaborative visual tools, proving that in the modern business landscape, clarity is not just seen, it is strategically designed.